


Every turnaround ends with a debrief, and every debrief eventually arrives at the same question: was it actually a success? “We finished” isn’t an answer. Neither is “we came in under budget,” if that number was hit by cutting scope that should have been done. Real turnaround performance has to be measured across multiple dimensions at once — schedule, cost, quality, safety, and the reliability outcomes that show up months later.
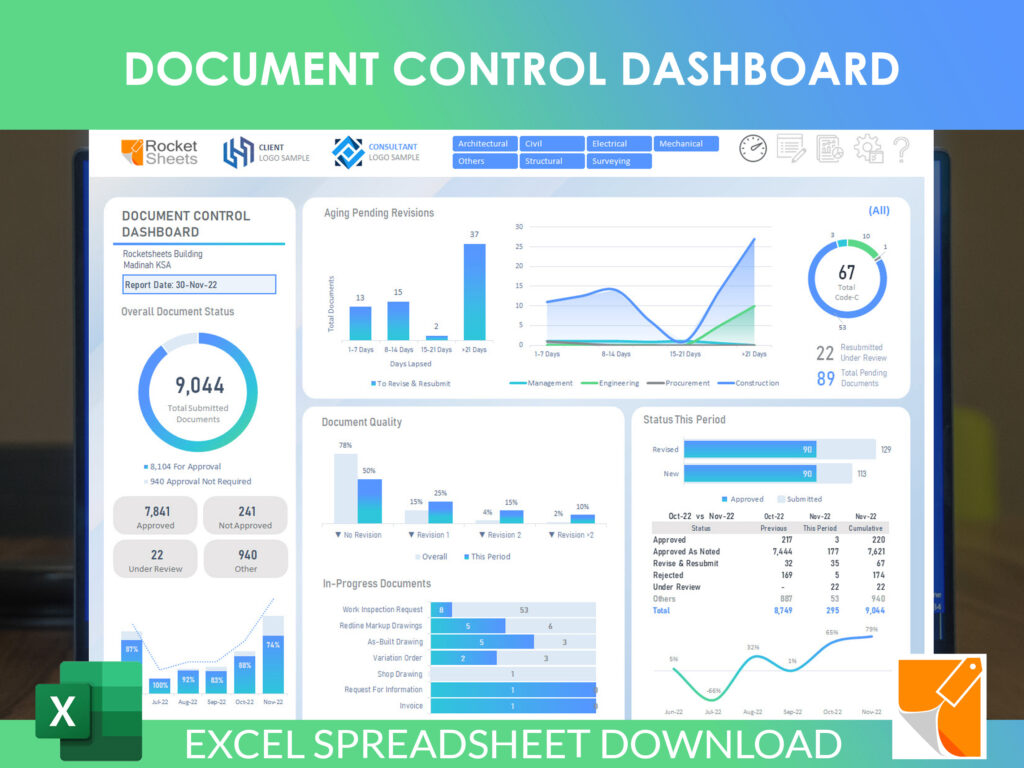
This guide breaks down the core turnaround KPIs that mid-level managers and planners actually use to evaluate shutdown performance, how to calculate each one, and how to pull them together into a dashboard you can review in real time during the outage and revisit in the post-TA report.
Schedule Performance Index (SPI) and Cost Performance Index (CPI)
SPI and CPI come from earned value management (EVM), and they remain two of the most reliable top-line indicators of turnaround health because they compare planned progress against actual progress, rather than just tracking days elapsed or dollars spent in isolation.
Schedule Performance Index (SPI) = Earned Value (EV) ÷ Planned Value (PV)
EV is the budgeted cost of work actually completed; PV is the budgeted cost of work that was scheduled to be completed by that point. An SPI of 1.0 means you’re exactly on schedule. Below 1.0 means you’re behind; above 1.0 means you’re ahead.
Cost Performance Index (CPI) = Earned Value (EV) ÷ Actual Cost (AC)
A CPI below 1.0 means you’re spending more than the value of work completed — you’re over budget relative to progress. Above 1.0 means you’re under budget relative to progress.
The reason these two indices matter more than raw percent-complete or dollars-spent figures is that they correct for the most common reporting distortion in turnarounds: work that looks “on track” by calendar days but is actually behind on scope, or spending that looks “under budget” only because work hasn’t been done yet. Tracking SPI and CPI daily during the outage — not just at the end — lets you catch schedule or cost erosion early enough to actually respond, whether that means adding crews, resequencing work, or escalating a scope decision.
Work Pack Completion Rate
Work pack completion rate measures the percentage of planned work packages (job cards, work orders, or whatever unit your TA management system uses) that are completed, verified, and closed out against the total number planned for that period or for the outage overall.
This metric is most useful when tracked daily against the plan, not just totaled at the end. A turnaround that’s “92% complete” in the final week tells you almost nothing on its own — what matters is whether completion rate has been tracking the planned S-curve throughout the outage, or whether it lagged early and is now being rushed to catch up, which often correlates with quality and safety shortcuts in the final days.
It’s worth tracking this metric by discipline (mechanical, E&I, NDT, etc.) as well as in aggregate. An overall completion rate of 90% can hide one trade running at 60%, and that trade is usually the one holding up startup.
Scope Growth Percentage
Scope growth is one of the most politically sensitive KPIs in any turnaround, because it raises the question of whether the original plan was wrong or whether the unit simply revealed problems once it was opened up. Either way, it needs to be tracked honestly.
Scope growth % = (Added scope value − Descoped value) ÷ Original approved scope value × 100
Most turnarounds run somewhere between 5% and 15% scope growth as a matter of course — inspection findings on opened equipment are expected, and a TA with zero scope growth is sometimes a sign that inspection scope itself was too thin. The KPI becomes a red flag when growth runs well above that baseline, or when it’s concentrated late in the outage rather than identified during the early inspection window, since late-discovered scope is the kind most likely to extend the schedule.
A useful refinement is to split this metric into two categories: scope growth from inspection findings (largely unavoidable) versus scope growth from planning gaps (work that should have been identified during the freeze scope but wasn’t). The first tells you about the unit’s condition; the second tells you about the quality of your planning process.
Safety Leading Indicators
Lagging indicators like TRIR and lost-time incidents tell you what already happened. Leading indicators tell you what’s likely to happen, and they’re the metrics turnaround managers should actually be watching in real time during the outage. The two most common:
Near-miss reports. A rising rate of near-miss reporting is usually a good sign during a turnaround — it indicates an active reporting culture catching problems before they become incidents. A near-zero near-miss count on a large, high-tempo turnaround is a warning sign of underreporting, not a clean safety record.
Toolbox talk attendance. Tracking attendance at daily toolbox talks (as a percentage of badged-in workforce) is a simple but effective proxy for how seriously safety communication is being taken on a given day or by a given contractor crew. A drop in attendance during the high-pressure final week of an outage — exactly when fatigue and schedule pressure are highest — is worth flagging immediately.
Other leading indicators worth tracking include permit-to-work compliance rates, audit/observation counts (e.g., behavior-based safety observations per shift), and corrective action closure time for identified hazards. The common thread across all of these: leading indicators are about behavior and process discipline, and they tend to move before incident rates do, which is exactly why they’re worth watching during the outage rather than only in the post-TA report.
Critical Path Adherence
Critical path adherence tracks how closely actual progress on critical path activities matches the planned critical path schedule — distinct from overall schedule performance, because non-critical work can run behind without affecting the finish date, while even small slips on critical path activities flow directly into the completion date.
This is typically tracked as the number of critical path activities completed on or ahead of their planned finish date, divided by the total number of critical path activities due in that period. It’s also useful to track critical path float erosion — how much buffer the schedule had at the start of the outage versus how much remains — since a shrinking float on paper is often the earliest hard evidence that the back end of the schedule is at risk, well before the completion percentage shows it.
Daily critical path reviews during execution, not just weekly schedule updates, are standard practice on well-run turnarounds for exactly this reason — critical path slippage compounds quickly and is far easier to recover from on day 3 than on day 12.
First-Time Quality Rate on Inspections
First-time quality (FTQ) rate measures the percentage of inspections, tests, or completed work items that pass without requiring rework, re-test, or re-inspection.
FTQ rate = (Total inspections − Failed/reworked inspections) ÷ Total inspections × 100
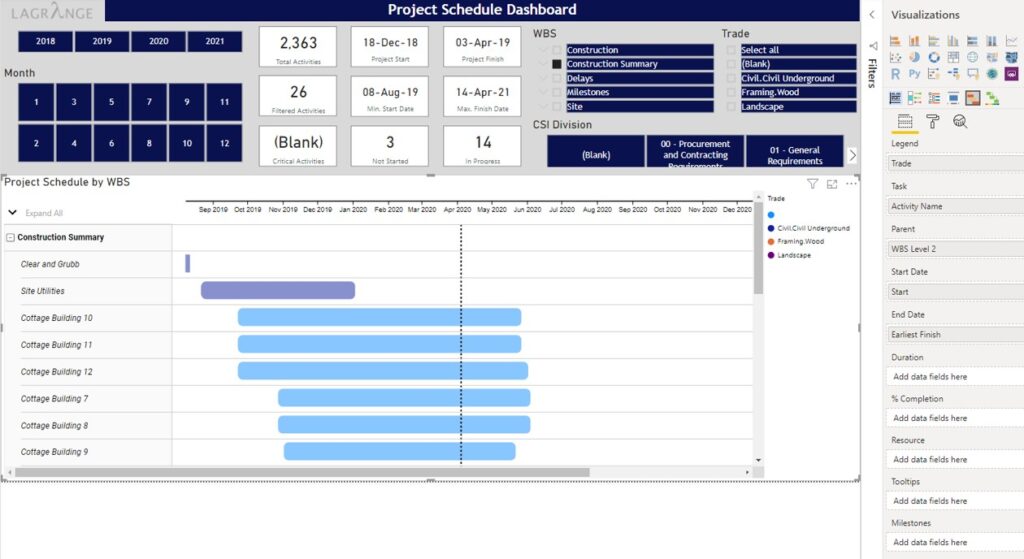
This metric matters for two reasons. First, rework is one of the most expensive and schedule-damaging outcomes in a turnaround, because it often means re-accessing equipment that scaffolding has already been stripped from, or re-isolating equipment that’s already been returned to a ready-for-service state. Second, a declining FTQ rate over the course of an outage is frequently an early signal of crew fatigue, schedule pressure pushing crews to rush, or quality oversight being stretched too thin as headcount peaks.
Tracking FTQ by discipline and even by individual inspector or contractor crew, rather than just in aggregate, helps identify whether a quality problem is systemic or localized — and whether it’s worth flagging for the next turnaround’s contractor selection process.
Post-TA Reliability Metrics: MTBF and Equipment Availability
The metrics above all measure how the turnaround itself went. The metrics below measure whether the turnaround actually achieved its purpose — because a TA that finished on time and on budget but didn’t fix the underlying reliability problems wasn’t really successful.
Mean Time Between Failures (MTBF) for critical equipment, tracked for the months following startup and compared against pre-TA MTBF, is the clearest evidence of whether the maintenance and repair work actually addressed root causes rather than just restoring equipment to a marginal operating condition.
Equipment availability (uptime as a percentage of scheduled run time) in the run period following the turnaround, compared to the run period before it, tells a similar story at the unit level. A unit that returns to the same availability problems within a few months of a major turnaround usually points to either inadequate scope, poor execution quality on critical repairs, or both.
These post-TA metrics typically need 60–180 days of run time to become meaningful, which means they belong in a structured follow-up review, not just the immediate post-TA report. Many organizations skip this step entirely and lose the single best piece of evidence about whether their turnaround strategy is actually working.
Building a KPI Dashboard
Pulling these metrics into a single dashboard — reviewed daily during execution and summarized weekly for leadership — is what turns KPI tracking from a reporting exercise into an actual management tool. A practical structure:
| KPI Category | Metric | Target/Threshold | Review Frequency |
|---|---|---|---|
| Schedule | SPI | ≥ 0.95 | Daily |
| Cost | CPI | ≥ 0.95 | Daily |
| Execution | Work pack completion vs. plan | Within 5% of S-curve | Daily |
| Scope | Scope growth % | ≤ 10–15% (context-dependent) | Weekly |
| Safety | Near-miss reports per 1,000 hours | Trending up or stable | Daily |
| Safety | Toolbox talk attendance | ≥ 95% | Daily |
| Schedule | Critical path float remaining | Tracked vs. baseline | Daily |
| Quality | First-time quality rate | ≥ 90–95% | Weekly |
| Reliability | MTBF vs. pre-TA baseline | Improvement vs. baseline | 90–180 days post-TA |
| Reliability | Equipment availability vs. pre-TA | Improvement vs. baseline | 90–180 days post-TA |
The specific thresholds will vary by site, process type, and how aggressive the outage scope was, so treat the numbers above as a starting point rather than an industry standard. What matters more than the exact targets is the structure: a mix of leading and lagging indicators, reviewed at the right frequency for each (daily during execution, longer-cycle for reliability outcomes), with clear ownership for who reviews and acts on each number.
Many turnaround teams build this dashboard in whatever project management or EVM software they already use for scheduling and cost control, since most modern platforms can pull SPI, CPI, and completion data directly from the schedule and cost baseline. The key is making sure safety leading indicators and post-TA reliability metrics — which often live in separate systems (EHS software, CMMS/reliability platforms) — get pulled into the same view rather than living in silos that only get reconciled months later, if at all.
Turning Metrics Into Better Turnarounds
No single KPI tells the whole story of a turnaround’s success. A shutdown can hit every schedule and cost target and still fail if quality was sacrificed to get there, or if the reliability problems it was meant to fix come right back within a quarter. Tracking SPI and CPI alongside scope growth, safety leading indicators, critical path adherence, first-time quality, and — critically — post-TA reliability outcomes gives you a much more complete picture, and gives your next turnaround a real benchmark to improve against.
Leave a Reply